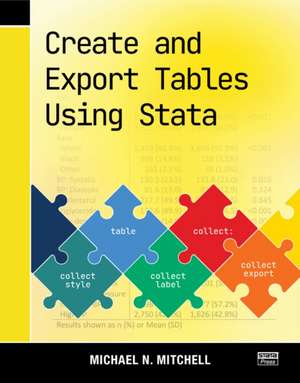
Create and Export Tables Using Stata
Autor Michael N. Mitchellen Limba Engleză Paperback – 10 dec 2024
În fluxul de lucru al oricărui cercetător, prezentarea datelor este la fel de critică precum analiza lor. În Create and Export Tables Using Stata, descoperim o resursă tehnică esențială care se concentrează pe noile funcționalități din Stata, în special pe comenzile `table`, `dtable`, `etable` și puternica suită `collect`. Importanța acestei lucrări rezidă în abordarea sa pragmatică: autorul a analizat sute de publicații academice pentru a extrage exact acele machete de tabele cerute de revistele de specialitate.
Remarcăm o structură progresivă, care debutează cu 24 de exemple practice de tabele gata de utilizat, de la teste t la modele de regresie complexe cu rezultate multiple. Dacă A Visual Guide to Stata Graphics v-a oferit instrumentele pentru reprezentarea vizuală a datelor, această carte completează arsenalul metodologic prin controlul absolut asupra output-ului tabelar. Michael N. Mitchell depășește simpla generare de cifre, explicând cum pot fi create celule compozite — cum ar fi combinarea mediei cu eroarea standard sau a medianei cu intervalul intercuartilic — direct în mediul de lucru Stata.
Spre deosebire de Interpreting and Visualizing Regression Models Using Stata, unde accentul cade pe interpretarea teoretică a modelelor, volumul de față este un manual de inginerie a raportării. Partea finală a cărții oferă o privire „sub capotă”, detaliind funcționarea colecțiilor de date, ceea ce permite utilizatorului avansat să automatizeze și să personalizeze complet exportul către formate Word, PDF sau Excel. Este, în esență, puntea necesară între analiza brută și manuscrisul final pregătit pentru publicare.
Preț: 498.41 lei
Preț vechi: 623.02 lei
-20%
Carte disponibilă
Livrare economică 19 august-02 septembrie
Livrare express 05-11 august pentru 49.82 lei
Specificații
ISBN-10: 1597183695
Pagini: 461
Dimensiuni: 184 x 233 x 29 mm
Greutate: 0.96 kg
Ediția:1
Editura: Stata Press
Colecția Stata Press
V-ar putea interesa
-
 Preț: 208.25 lei
 -
 Presenting Medical Statistics from Proposal to PublicationJanet L. Peacock-22%Preț: 407.85 lei519.79 lei
 -
 The Stata Survival ManualDavid Pevalin-27%Preț: 236.83 lei326.10 lei
 -
 -18%Preț: 277.90 lei339.13 lei
 -
 Applied Statistics for the Social and Health SciencesRachel A. GordonPreț: 438.07 lei
 -
 -22%Preț: 880.91 lei1129.37 lei
 -
 Applied Regression Models in the Social SciencesDudley L Poston Jr-19%Preț: 732.30 lei904.07 lei
 -
 R-TiculateMartin Bader-23%Preț: 645.14 lei837.85 lei
 -
 Preț: 363.70 lei
 -
 The Data Hero PlaybookMalcolm HawkerPreț: 202.67 lei
 -
 Statistical Analysis with Python For DummiesJoseph SchmullerPreț: 194.24 lei
 -
 -8%Preț: 478.38 lei519.98 lei
 -
 Data Management Using Stata: A Practical HandbookMichael N. Mitchell-20%Preț: 463.29 lei579.12 lei
 -
 Interpreting and Visualizing Regression Models Using StataMichael N. Mitchell-8%Preț: 484.46 lei526.58 lei
 -
 A Visual Guide to Stata GraphicsMichael N. Mitchell-8%Preț: 599.81 lei651.97 lei
 -
 Stata Tips, Fourth Edition, Volumes I and IINicholas J Cox-8%Preț: 536.83 lei583.52 lei
 -
 Stata Tips, Fourth Edition, Volume II: Tips 120-152Nicholas J CoxPreț: 336.33 lei
 -
 Maximum Likelihood Estimation with Stata, Fifth EditionJeffrey Pitblado-8%Preț: 480.99 lei522.81 lei
 -
 Statistics for ScientistsUmberto Michelucci-20%Preț: 275.88 lei344.84 lei
Public țintă
Academic, Postgraduate, and Professional Practice & DevelopmentDe ce să citești această carte
Recomandăm această carte cercetătorilor și studenților postuniversitari care doresc să elimine procesul manual de formatare a tabelelor în Word sau Excel. Veți câștiga un control precis asupra modului în care statisticile de regresie și descriptive sunt prezentate, învățând să automatizați generarea unor tabele de calitate academică folosind cele mai noi comenzi din Stata.
Despre autor
Michael N. Mitchell este un autor consacrat în ecosistemul Stata Press, cunoscut pentru abilitatea sa de a traduce proceduri statistice complexe în ghiduri vizuale și practice. Cu o experiență vastă în consultanță și cercetare, Mitchell a semnat lucrări fundamentale precum Stata for the Behavioral Sciences și A Visual Guide to Stata Graphics. Expertiza sa se concentrează pe eficientizarea fluxului de lucru pentru cercetători, transformând software-ul dintr-un simplu instrument de calcul într-un partener complet de analiză și raportare.
Descriere scurtă
This book begins with 24 sample tables, including 6 examples of a Table 1, 8 examples of regression models, 4 examples with Student's t tests, and an example of reporting results from a pretest–posttest design. Each sample table is illustrated step by step, showing you how to create it, customize it, and export it as a Word document. You'll also learn how you can export your table as a PDF or an Excel spreadsheet.
After the quick examples, the book takes a more thorough look at the process of creating a Table 1—a table of descriptive statistics that optionally includes a comparison across groups. This discussion also includes extensive instruction on how to create different types of composite results to include in your table; composite results combine multiple statistics into one cell, such as the mean (SE) or median (IQR).
Next Mitchell focuses on creating tables from regression models, such as multiple regression, multivariate regression, logistic, and multinomial logistic models, and illustrates how to make tables that combine results from several models.
The book ends with a look under the hood, describing what a collection looks like and the steps used by the collect suite of commands for creating a table and filling it in based on the contents of the collection. This information can help you more deeply understand the process of creating tables and help you make more complex tables using Stata.
Create and Export Tables Using Stata is integral to anyone reporting data characteristics or analysis. You will learn how to create tables with the layout, formatting, and style you need. Optimize your workflow by using your styles to automate the creation of any future tables. You will take this book off your shelf over and over again as it quickly becomes your go-to reference for creating tables in Stata.