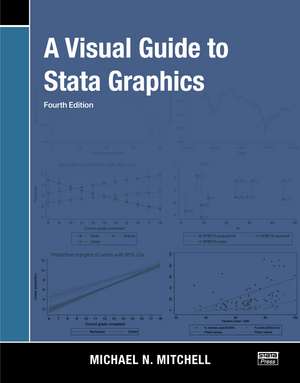
A Visual Guide to Stata Graphics
Autor Michael N. Mitchellen Limba Engleză Paperback – feb 2022
Preț: 597.99 lei
Preț vechi: 649.99 lei
-8%
Puncte Express: 897
Carte disponibilă
Livrare economică 30 octombrie-13 noiembrie
Livrare express 16-22 octombrie pentru 59.29 lei
Livrare prin curier în România Termenul estimat este afișat lângă disponibilitate.
Transport gratuit pentru acest produs Plată online sau ramburs, în funcție de opțiunile comenzii.
Retur gratuit în 14 zile Comandă securizată și suport în română.
Specificații
ISBN-13: 9781597183659
ISBN-10: 1597183652
Pagini: 499
Ilustrații: over 1,200 illustrated colored examples
Dimensiuni: 185 x 236 x 35 mm
Greutate: 1.12 kg
Ediția:4 ed
Editura: Stata Press
Colecția Stata Press
ISBN-10: 1597183652
Pagini: 499
Ilustrații: over 1,200 illustrated colored examples
Dimensiuni: 185 x 236 x 35 mm
Greutate: 1.12 kg
Ediția:4 ed
Editura: Stata Press
Colecția Stata Press
Public țintă
Academic, Postgraduate, Professional, and Professional Practice & DevelopmentCuprins
1. Introduction 2. Twoway graphs 3. Scatterplot matrix graphs 4. Bar graphs 5. Box plots 6. Dot plots 7. Pie charts 8. Options available for most graphs 9. Standard options available for all graphs 10. Styles for changing the look of graphs 11. Appendix
Notă biografică
Michael N. Mitchell is a senior statistician working in the area of sleep research as well as working on prevention of child maltreatment with the Children’s Data Network. He is the author of three other Stata Press books—Interpreting and Visualizing Regression Models Using Stata, Data Management Using Stata, and Stata for the Behavioral Sciences.
Descriere
Whether you are new to Stata graphics or a seasoned veteran, this book will teach you how to use Stata to make publication-quality graphs that will stand out and enhance your statistical results.