Cantitate/Preț
Produs

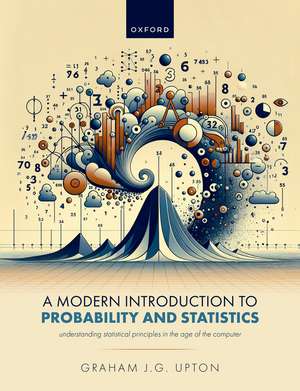
A Modern Introduction to Probability and Statistics: Understanding Statistical Principles in the Age of the Computer

Autor Graham J. G. Upton
en Limba Engleză Paperback – iul 2025

Relevanța acestui volum pentru examenele de statistică și certificările în analiza datelor derivă din abordarea sa pragmatică, adaptată nevoilor actuale din inteligența artificială și știința datelor. A Modern Introduction to Probability and Statistics nu se mulțumește doar cu expunerea fundamentelor teoretice, ci face pasul necesar către aplicabilitatea lor în era digitală. Găsim în această carte o structură bine definită, unde primele capitole acoperă probabilitățile condiționate și distribuțiile standard într-o manieră clasică, oferind rigoarea necesară pentru orice parcurs academic solid.

Ceea ce diferențiază lucrarea scrisă de Graham J. G. Upton este tranziția fluidă către puterea de calcul a computerului modern. Ne-a atras atenția modul în care autorul integrează comenzile R la finalul fiecărui capitol, transformând teoria abstractă în instrumente de lucru imediate. Această ediție rafinează conceptele din lucrarea anterioară a autorului, oferind un echilibru între demonstrație și simulare. Ca alternativă la Introduction to Probability, Statistics & R de Sujit K. Sahu pentru cursurile de licență și masterat, volumul lui Upton are avantajul unei structuri modulare: secțiunile cu grad ridicat de dificultate matematică sunt marcate distinct, permițând cititorului să își adapteze ritmul de învățare în funcție de profilul facultății, fie că este vorba de inginerie sau informatică. Față de Probability with R de Jane M Horgan, care pune accentul pe simulare, acest titlu păstrează o ancorare mai profundă în principiile statistice fundamentale, oferind în același timp soluții complete pentru exercițiile propuse, un element esențial pentru studiul individual.

Citește tot Restrânge

Preț: 31564 lei

Preț vechi: 35224 lei
-10%

Puncte Express: 473

Carte disponibilă

Livrare economică 17-22 septembrie
Livrare express 28 august-03 septembrie pentru 8625 lei

Livrare prin curier în România Termenul estimat este afișat lângă disponibilitate.
Transport gratuit de la 40000 lei Plată online sau ramburs, în funcție de opțiunile comenzii.
Retur gratuit în 14 zile Comandă securizată și suport în română.

Specificații

ISBN-13: 9780198943136
ISBN-10: 019894313X
Pagini: 384
Ilustrații: 82
Dimensiuni: 190 x 245 x 17 mm
Greutate: 0.79 kg
Editura: OUP OXFORD
Colecția OUP Oxford
Locul publicării:Oxford, United Kingdom

De ce să citești această carte

Această carte este ideală pentru studenții la master sau profesioniștii care doresc să înțeleagă statistica dincolo de formule. Cititorul câștigă capacitatea de a utiliza limbajul R pentru calcule complexe, păstrând în același timp controlul asupra fundamentelor matematice. Este un instrument excelent pentru cei care se pregătesc pentru cariere în AI, oferind un parcurs de învățare flexibil și extrem de aplicat.


Despre autor

Graham J. G. Upton este un autor respectat în domeniul matematicii și statisticii, cunoscut pentru capacitatea de a sintetiza concepte complexe în texte accesibile studenților. Activitatea sa academică s-a concentrat pe dezvoltarea unor metodologii de predare care să integreze progresele tehnologice în curricula tradițională. Prin lucrări precum cea de față, publicată de OUP OXFORD, Upton contribuie la formarea noilor generații de analiști de date, punând accent pe claritatea expunerii și pe utilitatea practică a instrumentelor statistice în contextul cercetării moderne.


Descriere

Probability and statistics are subjects fundamental to data analysis, making them essential for efficient artificial intelligence. Although the foundational concepts of probability and statistics remain constant, what needs to be taught is constantly evolving.The first half of the book introduces probability, conditional probability and the standard probability distributions in the traditional way. The second half considers the power of the modern computer and our reliance on technology to do the calculations for us. Offering a fresh presentation that builds on the author's previous book, Understanding Statistics, this book includes exercises (with solutions at the rear of the book) and worked examples. Chapters close with a brief mention of the relevant R commands and summary of the content. Increasingly difficult mathematical sections are clearly indicated, and these can be omitted without affecting the understanding of the remaining material.Aimed at first year graduates, this book is also suitable for readers familiar with mathematical notation.

Notă biografică

Graham Upton is a retired Professor of Applied Statistics, formerly of the Department of Mathematical sciences at The University of Essex. He has published numerous books, including The Oxford Dictionary of Statistics, Data Analysis: A Gentle Introduction for Future Data Scientists, and Understanding Statistics with OUP.

Cuprins

  • 1
  • Probability
  • 1: Probability
  • 1.1 Relative Frequency
  • 1.2 Preliminary definitions
  • 1.3 The probability scale
  • 1.4 Probability with equally likely outcomes
  • 1.5 The complementary event E'
  • 1.6 Venn diagrams
  • 1.7 Unions and intersections of events
  • 1.8 Mutually exclusive events
  • 1.9 Exhaustive events
  • 1.10 Probability trees
  • 1.11 Sample proportions and probability
  • 1.12 Unequally likely possibilities
  • 1.13 Physical independence
  • 1.14 Orderings
  • 1.15 Permutations and combinations
  • 1.16 Sampling without replacement
  • 1.17 Sampling without replacement
  • 2: Conditional Probability
  • 2.1 Notation
  • 2.2 Statistical independence
  • 2.3 Mutual and pairwise independence
  • 2.4 The total probability theorem (The partition theorem)
  • 2.5 Bayes' theorem
  • 2.6 *The Monty Hall problem
  • 3: Probability distributions
  • 3.1 Notation
  • 3.2 Probability distributions
  • 3.3 The discrete uniform distribution
  • 3.4 The Bernoulli distribution
  • 3.5 The Binomial Distribution
  • 3.6 Notation
  • 3.7 'Successes' and 'Failures'
  • 3.8 The shape of the binomial distribution
  • 3.9 The geometric distribution
  • 3.10 The Poisson distribution and the Poisson process
  • 3.11 The form of the distribution
  • 3.12 Sums of Poisson random variables
  • 3.13 The Poisson approximation to the binomial
  • 3.14 The negative binomial distribution
  • 3.15 The hypergeometric distribution
  • 4: Expectations
  • 4.1 Expectations of functions
  • 4.2 The population variance
  • 4.3 Sums of random variables
  • 4.4 Mean and variance of common distributions
  • 4.5 The expectation and variance of the sample mean
  • 5: Continuous random variables
  • 5.1 The probability density function (pdf)
  • 5.2 The cumulative distribution function, F
  • 5.3 Expectations for continuous variables
  • 5.4 Obtaining f from F
  • 5.5 The uniform (rectangular) distribution
  • 5.6 The exponential distribution
  • 5.7 *The beta distribution
  • 5.8 *The gamma distribution
  • 5.9 *Transformation of a random variable
  • 6: The Normal Distribution
  • 6.1 The general normal distribution
  • 6.2 The use of tables
  • 6.3 Linear combinations of independent normal random variables
  • 6.4 The Central Limit Theorem
  • 6.5 The normal distribution used as an approximation
  • 6.6 *Proof that the area under the normal curve is 1
  • 7: Distributions related to the normal distribution
  • 7.1 The t distribution
  • 7.2 The chi-squared distribution
  • 7.3 The F distribution
  • 8: *Generating functions
  • 8.1 The probability generating function, G
  • 8.2 The moment generating function
  • 9: *Inequalities and laws
  • 9.1 Markov's inequality
  • 9.2 Chebyshev's inequality
  • 9.3 The weak law of large numbers
  • 9.4 The strong law of large numbers
  • 10: Joint Distributions
  • 10.1 Joint probability mass function
  • 10.2 Marginal distributions
  • 10.3 Conditional distributions
  • 10.4
  • 2
  • Statistics
  • 11: Data sources
  • 11.1 Data collection by observation
  • 11.2 National Consuses
  • 11.3 Sampling
  • 11.4 Questionnaires
  • 11.5 Questionnaire Design
  • 12: Summarising data
  • 12.1 A single variable
  • 12.2 Two variables
  • 12.3 More than two variables
  • 12.4 Choosing which display to use
  • 12.5 Dirty Data
  • 13: General Summary Statistics
  • 13.1 Measure of location: The mode
  • 13.2 Measure of location: The mean
  • 13.3 Measure of location: The mean of a frequency distribution
  • 13.4 Measure of location: The mean of grouped data
  • 13.5 Simplifying calculations
  • 13.6 Measure of location: The median
  • 13.7 Quantiles
  • 13.8 Measures of spread: The Range and Inter-quartile Range
  • 13.9 Boxplot
  • 13.10 Deviations from the mean
  • 13.11 The mean deviation
  • 13.12 Measure of spread: The variance
  • 13.13 Calculating the variance by hand
  • 13.14 Measure of spread: The standard deviation
  • 13.15 Variance and standard deviation for frequency distributions
  • 13.16 Symmetric and skewed data
  • 13.17 Standardising to a prescribed mean and standard deviation
  • 13.8 *Calculating the combined mean and variance of several samples
  • 13.19 Combining proportions
  • 14: Point and interval estimation
  • 14.1 Point estimates
  • 14.2 Estimation methods
  • 14.3 Confidence intervals
  • 14.4 Confidence intervals with discrete distributions
  • 14.5 One-sided confidence intervals
  • 14.6 Confidence intervals for a variance
  • 15: Single-sampled hypothesis tests
  • 15.1 The null and alternative hypothesis
  • 15.2 Critical regions and significance levels
  • 15.3 The test procedure
  • 15.4 Identifying two hypotheses
  • 15.5 Tail probabilities: the p value approach
  • 15.6 Hypothesis tests and confidence intervals
  • 15.7 Hypothesis tests for a mean
  • 15.8 Testing for normality
  • 15.9 Hypothesis test for the variance of a normal distribution
  • 5.10 Hypothesis tests with discrete distributions
  • 5.11 Type I and Type II errors
  • 5.12 Hypothesis tests for a proportion based on a small sample
  • 15.13 Hypothesis tests for a Poisson mean based on a small sample
  • 16: Two samples and paired samples
  • 16.1 The comparison of two means
  • 16.2 Confidence interval for the difference between two normal means
  • 16.3 Paired samples
  • 16.4 The comparison of the variances of two normal distributions
  • 16.5 Confidence interval for a variance ratio
  • 17: Goodness of fit
  • 17.1 The chi-squared test
  • 17.2 Small expected frequencies
  • 17.3 Goodness of fit to prescribed distribution type
  • 17.4 Comparing distribution functions
  • 17.5 The dispersion test
  • 17.6 Contingency tables
  • 17.7 The 2 x 2 table: the comparison of two proportions
  • 17.8 *Multi-way contingency tables
  • 18: Correlation
  • 18.1 The product-moment correlation coefficent
  • 18.2 Nonsense correlation: storks and goosebury bushes
  • 18.3 The ecological fallacy: Immigration and illiteracy
  • 18.4 Simpson's paradox: Amputation or injection?
  • 18.5 Rank correlation
  • 19: Regression
  • 19.1 The equation of a straight line
  • 19.2 Why 'regression'?
  • 19.3 The method of least squares
  • 19.4 Transformations, extrapolation and outliers
  • 19.5 Properties of the estimators
  • 19.6 Analysis of Variance (ANOVA)
  • 19.7 Multiple Regression
  • 20 *The Bayesian approach