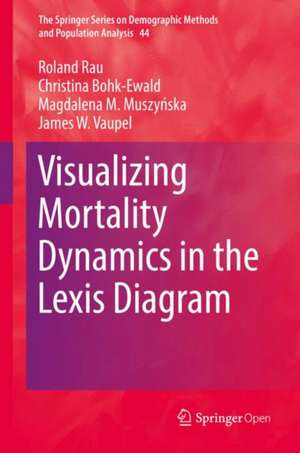
Visualizing Mortality Dynamics in the Lexis Diagram: The Springer Series on Demographic Methods and Population Analysis, cartea 44
Autor Roland Rau, Christina Bohk-Ewald, Magdalena M. Muszy¿ska, James W. Vaupelen Limba Engleză Hardback – 23 noi 2017
Din seria The Springer Series on Demographic Methods and Population Analysis
- 18%
 Preț: 920.47 lei
 - 18%
 Preț: 919.29 lei
 - 15%
 Preț: 616.07 lei
 - 15%
 Preț: 617.36 lei
 - 18%
 Preț: 1079.97 lei
 - 18%
 Preț: 918.47 lei
 -
 Preț: 388.79 lei
 - 18%
 Preț: 956.14 lei
 - 15%
 Preț: 649.25 lei
 - 18%
 Preț: 914.22 lei
 - 18%
 Preț: 965.68 lei
 -
 Preț: 381.92 lei
 - 15%
 Preț: 618.34 lei
 - 15%
 Preț: 622.78 lei
 - 15%
 Preț: 615.62 lei
 - 18%
 Preț: 1333.52 lei
 - 18%
 Preț: 921.94 lei
 - 18%
 Preț: 911.37 lei
 - 15%
 Preț: 617.46 lei
 - 18%
 Preț: 915.08 lei
 - 15%
 Preț: 616.24 lei
 - 15%
 Preț: 640.89 lei
 - 15%
 Preț: 641.76 lei
 - 15%
 Preț: 621.52 lei
 - 15%
 Preț: 617.66 lei
 - 15%
 Preț: 615.83 lei
 - 15%
 Preț: 639.64 lei
 - 15%
 Preț: 609.61 lei
 - 18%
 Preț: 909.62 lei
 - 30%
 Preț: 979.06 lei
 - 15%
 Preț: 622.74 lei
 - 5%
 Preț: 1249.83 lei
 - 18%
 Preț: 956.60 lei
 - 15%
 Preț: 650.48 lei
Preț: 408.14 lei
Puncte Express: 612
Carte tipărită la comandă
Livrare economică 17 noiembrie-01 decembrie
Livrare prin curier în România Termenul estimat este afișat lângă disponibilitate.
Transport gratuit pentru acest produs Plată online sau ramburs, în funcție de opțiunile comenzii.
Retur gratuit în 14 zile Comandă securizată și suport în română.
Specificații
ISBN-13: 9783319648187
ISBN-10: 3319648187
Pagini: 184
Ilustrații: XIII, 169 p. 114 illus.
Dimensiuni: 160 x 241 x 16 mm
Greutate: 0.45 kg
Ediția:1st edition 2018
Editura: Springer
Colecția The Springer Series on Demographic Methods and Population Analysis
Seria The Springer Series on Demographic Methods and Population Analysis
Locul publicării:Cham, Switzerland
ISBN-10: 3319648187
Pagini: 184
Ilustrații: XIII, 169 p. 114 illus.
Dimensiuni: 160 x 241 x 16 mm
Greutate: 0.45 kg
Ediția:1st edition 2018
Editura: Springer
Colecția The Springer Series on Demographic Methods and Population Analysis
Seria The Springer Series on Demographic Methods and Population Analysis
Locul publicării:Cham, Switzerland
Cuprins
1: Introduction: Why do we visualize data and what is this book about?.- 2: The Lexis Diagram.- 3: Data and Software.- 4: Surface Plots of Observed Death Rates.- 5: Surface Plots of Smoothed Mortality Data.- 6: Surface Plots of Rates of Mortality Improvement.- 7: Surface Plots for Causes of Death.- 8: Surface Plots of Age-specific Contributions to the Increase in Life Expectancy.- 9: Seasonality of Causes of Death.- 10: Surface Plots for Cancer Survival.- 11: Summary and Outlook.- Bibliography.- References.- Additional Figures.
Textul de pe ultima copertă
This book visualizes mortality dynamics in the Lexis diagram. While the standard approach of plotting death rates is also covered, the focus in this book is on the depiction of rates of mortality improvement over age and time. This rather novel approach offers a more intuitive understanding of the underlying dynamics, enabling readers to better understand whether period- or cohort-effects were instrumental for the development of mortality in a particular country. Besides maps for single countries, the book includes maps on the dynamics of selected causes of death in the United States, such as cardiovascular diseases or lung cancer. The book also features maps for age-specific contributions to the change in life expectancy, for cancer survival and for seasonality in mortality for selected causes of death in the United States. The book is accompanied by instructions on how to use the freely available R Software to produce these types of surface maps. Readers are encouraged to use the presented tools to visualize other demographic data or any event that can be measured by age and calendar time, allowing them to adapt the methods to their respective research interests. The intended audience is anyone who is interested in visualizing data by age and calendar time; no specialist knowledge is required. This book is open access under a CC BY license.
Caracteristici
Provides a graphical analysis of period- and cohort-effects in mortality Offers readers a visual understanding of how mortality changes dynamically Accompanied by instructions on how to use the R Software to produce surface maps