
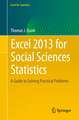
Excel 2013 for Educational and Psychological Statistics: Excel for Statistics
Autor Thomas J. Quirken Limba Engleză Paperback – 11 ian 2016
Autorul Thomas J. Quirk, un expert recunoscut pentru capacitatea de a traduce concepte statistice complexe în fluxuri de lucru accesibile, fundamentează această lucrare pe o metodologie pedagogică aplicată. Excel 2013 for Educational and Psychological Statistics nu este doar un manual teoretic, ci un ghid de tip „learning-by-doing”, conceput special pentru studenții și profesioniștii din domeniul științelor sociale care privesc analiza datelor sau utilizarea computerului cu o anumită reticență. Găsim în această carte o abordare care demitizează calculul statistic, transformând Microsoft Excel dintr-un simplu tabel într-un instrument educațional puternic.
Această ediție marchează un moment important în seria Excel for Statistics, fiind prima adaptată riguros pentru cerințele specifice din educație și psihologie pentru versiunea 2013 a software-ului. Putem afirma că lucrarea urmează linia stabilită de volumul anterior, Excel 2010 for Educational and Psychological Statistics, dar aduce la zi comenzile și interfața grafică. Deși acoperă aceeași arie tematică precum Excel 2013 for Social Sciences Statistics, volumul de față se diferențiază prin natura problemelor practice propuse, care sunt extrase direct din contextul cercetării educaționale și al evaluărilor psihologice.
Structura este una progresivă și logică: se începe cu noțiuni de bază precum deviația standard și eroarea medie, se trece prin generarea de numere aleatorii și intervale de încredere, culminând cu analize de varianță (ANOVA) și regresii multiple. Notăm cu interes includerea unui test de practică integral la final, care, alături de soluțiile detaliate din apendice, permite o autoevaluare riguroasă. Fiecare capitol este construit în jurul unei probleme specifice, oferind instrucțiuni clare pentru utilizarea comenzilor Excel, ceea ce face ca progresia prin curriculumul de statistică să fie fluidă și ușor de urmărit.
Din seria Excel for Statistics
-
 Preț: 358.70 lei
-
 Preț: 391.62 lei
-
 Preț: 391.06 lei
- 5%
 Preț: 530.94 lei
-
 Preț: 487.08 lei
-
 Preț: 374.91 lei
-
 Preț: 392.00 lei
-
 Preț: 377.13 lei
-
 Preț: 370.85 lei
-
 Preț: 404.94 lei
- 5%
 Preț: 374.63 lei
-
 Preț: 406.68 lei
- 19%
 Preț: 622.83 lei
- 5%
 Preț: 528.17 lei
-
 Preț: 455.13 lei
- 15%
 Preț: 585.16 lei
-
 Preț: 389.02 lei
- 15%
 Preț: 528.78 lei
- 15%
 Preț: 482.10 lei
- 15%
 Preț: 402.83 lei
- 19%
 Preț: 506.70 lei
Preț: 373.57 lei
Carte disponibilă
Livrare economică 11-25 noiembrie
Specificații
ISBN-10: 3319267116
Pagini: 276
Ilustrații: XV, 258 p. 166 illus., 4 illus. in color.
Dimensiuni: 155 x 235 x 15 mm
Greutate: 0.47 kg
Ediția:1st edition 2015
Editura: Springer
Colecția Excel for Statistics
Seria Excel for Statistics
Locul publicării:Cham, Switzerland
V-ar putea interesa
-
 The Science of Web SurveysRoger Tourangeau-34%Preț: 667.30 lei1006.67 lei
-
 Using Complexity Theory for Research and Program EvaluationMichael Wolf-Branigin-21%Preț: 327.87 lei416.17 lei
-
 Ethics and Values in Social ResearchPaul Ransome-25%Preț: 291.43 lei388.02 lei
-
 Using Photographs in Social and Historical ResearchPenny Tinkler-15%Preț: 630.79 lei742.11 lei
-
 Constructing Grounded TheoryKathy CharmazPreț: 440.13 lei
-
 The Myth of Research-Based Policy and PracticeMartyn Hammersley-18%Preț: 726.30 lei885.72 lei
-
 Doing a Successful Research Project: Using Qualitative or Quantitative MethodsMartin Brett Davies-24%Preț: 204.06 lei267.88 lei
-
 Qualitative Research PracticeJane Ritchie-22%Preț: 413.02 lei529.51 lei
-
 Doing Research in Further Education and TrainingSusan WallacePreț: 324.99 lei
-
 The SAGE Handbook of Case-Based MethodsDavid ByrnePreț: 463.10 lei
-
 The SAGE Handbook of Educational Action ResearchSusan E. NoffkePreț: 295.69 lei
-
 Excel 2010 for Educational and Psychological StatisticsThomas J. QuirkPreț: 404.26 lei
-
 What is Qualitative Interviewing?Rosalind Edwards-17%Preț: 179.15 lei216.19 lei
-
 Who Counts?Jeremy HollandPreț: 163.07 lei
De ce să citești această carte
Această carte se adresează studenților și practicienilor din psihologie și educație care doresc să stăpânească statistica fără a se pierde în demonstrații matematice abstracte. Veți câștiga abilitatea practică de a rula teste t, corelații și ANOVA direct în Excel. Este soluția ideală pentru cei care au nevoie de un ghid vizual, pas cu pas, care transformă analiza datelor într-o sarcină gestionabilă și clară.
Despre autor
Thomas J. Quirk este un profesor și autor prolific, specializat în utilizarea Microsoft Excel ca instrument de predare a statisticilor aplicate. Expertiza sa este vastă, acoperind multiple discipline prin seria sa Excel for Statistics, de la inginerie la științe biologice. Stilul său se remarcă prin claritate și orientarea spre rezolvarea problemelor practice, fiind autorul unor lucrări de referință precum Excel 2019 for Engineering Statistics și Excel 2019 for Biological and Life Sciences Statistics. Prin volumele sale, Quirk a ajutat generații de studenți să depășească barierele tehnice ale analizei cantitative.
Cuprins
Recenzii
Textul de pe ultima copertă
Excel, a widely available computer program for students and practitioners, is also an effective teaching and learning tool for quantitative analyses in statistics courses. Its powerful computational ability and graphical functions make learning statistics much easier than in years past. However, Excel 2013 for Educational and Psychological Statistics: A Guide to Solving Practical Problems is the first book to capitalize on these improvements by teaching students and practitioners how to apply Excel to statistical techniques necessary in their courses and work.
Each chapter explains statistical formulas and directs the reader to use Excel commands to solve specific, easy-to-understand problems in education and psychology. Practice problems are provided at the end of each chapter with their solutions in an appendix. Separately, there is a full Practice Test (with answers in an Appendix) that allows readers to test what they have learned.
Includes 166 illustrations in color.
At the beginning of his academic career, Prof. Quirk spent six years in educational research at The American Institutes for Research and Educational Testing Service. He then taught Social Psychology, Educational Psychology, and General Psychology at Principia College, and is currently a Professor of Marketing in the George Herbert Walker School of Business & Technology at Webster University based in St. Louis, Missouri (USA) where he teaches Marketing Statistics, Marketing Research, and Pricing Strategies. He has published articles in the Journal of Educational Psychology, Journal of Educational Research, Review of Educational Research, Journal of Educational Measurement, Educational Technology, The Elementary School Journal, Journal of Secondary Education, Educational Horizons, and Phi Delta Kappan. In addition, he has written 60+ textbook supplements in Marketing and Management, published 20+ articles in professional journals, and presented 20+ papers at professional meetings, including annual meetings of The American Educational Research Association, The American Psychological Association, and the National Council on Measurement in Education. He holds a B.S. in Mathematics from John Carroll University, both an M.A. in Education and a Ph.D. in Educational Psychology from Stanford University, and an M.B.A. from The University of Missouri-St. Louis.