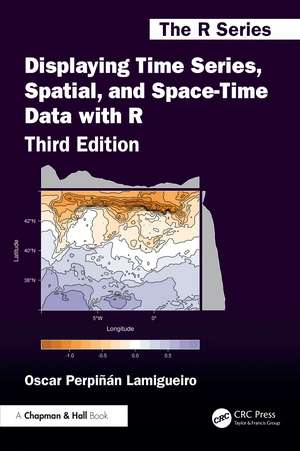
Displaying Time Series, Spatial, and Space-Time Data with R: Chapman & Hall/CRC The R Series
Autor Oscar Perpinan Lamigueiroen Limba Engleză Paperback – 9 noi 2025
While the first edition primarily focused on static graphics, and the second edition significantly expanded upon interactive elements, this edition has been thoroughly updated with a modern emphasis. Key enhancements include:
· Comprehensive updates to all chapters: Incorporating the latest advancements in packages like "sf" and "terra."
· New content: Introducing valuable topics such as trajectories, hill shading, and cartograms, enriching the scope of the book.
The book illustrates how to display a dataset starting with an easy and direct approach and progressively adding improvements that involve more complexity. Each of the three parts of the book is devoted to different types of data. In each part, the chapters are grouped according to the various visualization methods or data characteristics.
Features
• Offers detailed information on producing high-quality graphics, interactive visualizations, and animations
• Uses real data from meteorological, climate, economic, social science, energy, engineering, environmental, and epidemiological research in many practical examples
• Shows how to improve graphics based on visualization theory
• Provides the graphics, data, and R code on the author’s website, enabling you to practice with the methods and modify the code to suit your own needs.
Din seria Chapman & Hall/CRC The R Series
- 8%
 Preț: 443.06 lei
 - 8%
 Preț: 552.89 lei
 - 8%
 Preț: 494.07 lei
 - 20%
 Preț: 407.01 lei
 -
 Preț: 415.63 lei
 -
 Preț: 442.90 lei
 - 8%
 Preț: 612.02 lei
 - 15%
 Preț: 530.47 lei
 - 15%
 Preț: 453.73 lei
 - 15%
 Preț: 587.96 lei
 - 15%
 Preț: 607.18 lei
 - 20%
 Preț: 702.96 lei
 - 20%
 Preț: 1165.32 lei
 - 15%
 Preț: 543.36 lei
 - 15%
 Preț: 448.12 lei
 - 20%
 Preț: 1490.60 lei
 - 20%
 Preț: 728.89 lei
 - 18%
 Preț: 721.72 lei
 - 20%
 Preț: 514.78 lei
 - 15%
 Preț: 446.33 lei
 - 15%
 Preț: 605.86 lei
 -
 Preț: 237.42 lei
 - 18%
 Preț: 971.26 lei
 - 20%
 Preț: 1184.33 lei
 - 18%
 Preț: 1250.55 lei
 -
 Preț: 485.61 lei
 - 20%
 Preț: 401.62 lei
 - 20%
 Preț: 416.24 lei
 - 18%
 Preț: 940.17 lei
 -
 Preț: 212.42 lei
 - 20%
 Preț: 270.06 lei
 - 18%
 Preț: 1276.79 lei
 - 20%
 Preț: 1314.25 lei
 - 15%
 Preț: 566.12 lei
 - 18%
 Preț: 928.58 lei
 -
 Preț: 347.85 lei
 -
 Preț: 484.25 lei
 -
 Preț: 484.25 lei
Preț: 619.62 lei
Preț vechi: 728.97 lei
-15%
Puncte Express: 929
Carte tipărită la comandă
Livrare economică 03-17 septembrie
Livrare express 29 iulie-04 august pentru 65.82 lei
Livrare prin curier în România Termenul estimat este afișat lângă disponibilitate.
Transport gratuit pentru acest produs Plată online sau ramburs, în funcție de opțiunile comenzii.
Retur gratuit în 14 zile Comandă securizată și suport în română.
Specificații
ISBN-13: 9781032779201
ISBN-10: 1032779209
Pagini: 310
Ilustrații: 234
Dimensiuni: 156 x 234 x 17 mm
Greutate: 0.57 kg
Ediția:3. Auflage
Editura: CRC Press
Colecția Chapman and Hall/CRC
Seria Chapman & Hall/CRC The R Series
ISBN-10: 1032779209
Pagini: 310
Ilustrații: 234
Dimensiuni: 156 x 234 x 17 mm
Greutate: 0.57 kg
Ediția:3. Auflage
Editura: CRC Press
Colecția Chapman and Hall/CRC
Seria Chapman & Hall/CRC The R Series
Public țintă
Postgraduate, Professional Practice & Development, Professional Reference, Professional Training, and Undergraduate AdvancedCuprins
List of Figures 1 Introduction 1.1 What This Book Is About 1.2 What You Will Not Find in This Book 1.3 How to Read This Book 1.4 R Graphics 1.5 Packages 1.6 Software Used to Write This Book 1.7 About the Author 1.8 Acknowledgments I Time Series 2 Displaying Time Series: Introduction 2.1 Packages 2.2 Further Reading 3 Time on the Horizontal Axis 3.1 Time Graph of Variables with Different Scales 3.2 Time Series of Variables with the Same Scale 3.3 Stacked Graphs 3.4 Interactive Graphics 4 Time as a Conditioning or Grouping Variable 4.1 Scatterplot Matrix: Time as a Grouping Variable 4.2 Scatterplot with Time as a Conditioning Variable 5 Time as a Complementary Variable 5.1 Polylines 5.2 A Panel for Each Year 5.3 Interactive Graphics: Animation 6 About the Data 6.1 SIAR 6.2 Unemployment in the United States 6.3 Gross National Income and CO2 Emissions IISpatial Data 7 Displaying Spatial Data: Introduction 7.1 Packages 7.2 Further Reading 8 Thematic Maps: Proportional Symbol Mapping 8.1 Introduction 8.2 Proportional Symbol Mapping 8.3 Optimal Classification to Improve Discrimination 8.4 Spatial Context with Underlying Layers and Labels 8.5 Spatial Interpolation 8.6 Interactive Graphics 9 Thematic Maps: Choropleth Maps 9.1 Introduction 9.2 Quantitative Variable 9.3 Qualitative Variable 9.4 Small Multiples with Choropleth Maps 9.5 Bivariate Map 9.6 Interactive Graphics 10 Thematic Maps: Cartogram Maps 10.1 Introduction 10.2 Data 10.3 Cartograms 11 Thematic Maps: Raster Maps 11.1Quantitative Data 11.2 Categorical Data 11.3 Bivariate Legend 11.4 Interactive Graphics 12 Vector Fields 12.1 Introduction 12.2 Arrow Plot 12.3 Streamlines 13 Physical Maps 13.1 Introduction 13.2 Retrieving Data 13.3 Labels 13.4 Overlaying Layers of Information 14 Reference Maps 14.1 Introduction 14.2 Retrieving Data from OpenStreetMap 14.3 Hill Shading 14.4 Overlaying Layers of Information 15 About the Data 15.1 Air Quality in Madrid 15.2 Spanish General Elections 15.3 Gross Domestic Product and Population 15.4 CM SAF 15.5 Land Cover and Population RastersIII Space-Time Data 16 Displaying Spatiotemporal Data: Introduction 16.1 Packages 16.2 Further Reading 17 Spatiotemporal Point Observations 17.1 Introduction 17.2 Data processing 17.3 Graphics 17.4 Animation 18 Spatiotemporal Areal Data 8.1 Introduction 18.2 Data 18.3 Choropleth 18.4 Cartogram 19 Spatiotemporal Raster Data 19.1 Introduction 19.2 Level Plots 19.3 Graphical Exploratory Data Analysis 19.4 Space-Time and Time Series Plots 19.5 Animation 20 Animation 20.1 Time Trajectory 20.2 Fly-by Animation 20.3Hill shading animation IV Glossary, Bibliography and Index Bibliography Index
Notă biografică
Oscar Perpiñán-Lamigueiro is an Associate Professor at the Universidad Politécnica de Madrid, involved in teaching and research of Electrical Engineering, Electronics and Programming. He is also a lecturer of Photovoltaic and Solar Energy at the Escuela de Organización Industrial. He holds a Master's Degree in Telecommunications Engineering and a PhD in Industrial Engineering. At present, his research focuses on solar radiation (forecasting, spatial interpolation, open data) and software development with R (packages rasterVis, solaR, meteoForecast, PVF, tdr). https://www.routledge.com/authors/i2144-oscar-perpin-lamigueiro
Descriere
Focusing on the exploration of data with visual methods, the book presents methods and R code for producing high-quality static graphics, interactive visualizations, and animations, of time series, spatial, and space-time data. Practical examples using real-world datasets help you understand how to apply the methods and code.