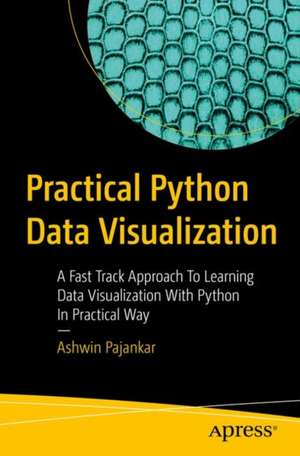
Practical Python Data Visualization
Autor Ashwin Pajankaren Limba Engleză Paperback – 25 oct 2020
Quickly start programming with Python 3 for data visualization with this step-by-step, detailed guide. This book’s programming-friendly approach using libraries such as leather, NumPy, Matplotlib, and Pandas will serve as a template for business and scientific visualizations.
You’ll begin by installing Python 3, see how to work in Jupyter notebook, and explore Leather, Python’s popular data visualization charting library. You’ll also be introduced to the scientific Python 3 ecosystem and work with the basics of NumPy, an integral part of that ecosystem. Later chapters are focused on various NumPy routines along with getting started with Scientific Data visualization using matplotlib. You’ll review the visualization of 3D data using graphs and networks and finish up by looking at data visualization with Pandas, including the visualization of COVID-19 data sets.
The code examples are tested on popular platforms like Ubuntu, Windows, and Raspberry Pi OS. WithPractical Python Data Visualization you’ll master the core concepts of data visualization with Pandas and the Jupyter notebook interface.
You’ll begin by installing Python 3, see how to work in Jupyter notebook, and explore Leather, Python’s popular data visualization charting library. You’ll also be introduced to the scientific Python 3 ecosystem and work with the basics of NumPy, an integral part of that ecosystem. Later chapters are focused on various NumPy routines along with getting started with Scientific Data visualization using matplotlib. You’ll review the visualization of 3D data using graphs and networks and finish up by looking at data visualization with Pandas, including the visualization of COVID-19 data sets.
The code examples are tested on popular platforms like Ubuntu, Windows, and Raspberry Pi OS. WithPractical Python Data Visualization you’ll master the core concepts of data visualization with Pandas and the Jupyter notebook interface.
What You'll Learn
- Review practical aspects of Python Data Visualization with programming-friendly abstractions
- Install Python 3 and Jupyter on multiple platforms including Windows, Raspberry Pi, and Ubuntu
- Visualize COVID-19 data sets with Pandas
Who This Book Is For
Preț: 295.42 lei
Preț vechi: 369.27 lei
-20%
Puncte Express: 443
Carte disponibilă
Livrare economică 05-19 noiembrie
Livrare prin curier în România Termenul estimat este afișat lângă disponibilitate.
Transport gratuit de la 400.00 lei Plată online sau ramburs, în funcție de opțiunile comenzii.
Retur gratuit în 14 zile Comandă securizată și suport în română.
Specificații
ISBN-13: 9781484264546
ISBN-10: 1484264541
Pagini: 176
Ilustrații: XV, 160 p. 117 illus.
Dimensiuni: 155 x 235 x 10 mm
Greutate: 0.26 kg
Ediția:First Edition
Editura: Apress
Locul publicării:Berkeley, CA, United States
ISBN-10: 1484264541
Pagini: 176
Ilustrații: XV, 160 p. 117 illus.
Dimensiuni: 155 x 235 x 10 mm
Greutate: 0.26 kg
Ediția:First Edition
Editura: Apress
Locul publicării:Berkeley, CA, United States
Cuprins
Chapter 1: Data Visualization with Leather.- Chapter 2: Introduction to the Scientific Python Ecosystem and NumPy.- Chapter 3: NumPy Routines and Visualization with Matplotlib.- Chapter 4: Visualizing images and 3D Shapes .- Chapter 5 :Visualize Networks and Graphs.- Chapter 6: Getting Started with Pandas.- Chapter 7: Processing and Visualizing COVID-19 Data.- Appendix.
Notă biografică
Ashwin Pajankar earned a Master of Technology in Computer Science Engineering from IIIT Hyderabad and has over 25 years of programming experience. He started his journey in programming and electronics at the tender age of 7 with a MS-DOS computer and BASIC programming language. He is now proficient in Assembly programming, C, C++, Java, Shell Scripting, JavaScript, Go Programming, HTML, and Python. His other technical expertise includes single board computers such as Raspberry Pi and Banana Pro, and microcontroller boards (Arduino), and embedded boards (BBC Micro Bit). He has worked extensively on domains such as Software/Product Testing, Software Automation, Databases, Data Analytics, Computer Vision, and Web Development.
Ashwin is currently a freelance online instructor teaching programming and electronics to more than 8200 professionals. He also regularly conducts live programming boot camps for software professionals. His growing Youtubechannel has an audience of more than 11000 subscribers. He has published more than 20 books on programming and electronics with many international publications, including Apress and regularly reviews books on programming written by other authors. Textul de pe ultima copertă
Quickly start programming with Python 3 for data visualization with this step-by-step, detailed guide. This book’s programming-friendly approach using libraries such as leather, NumPy, Matplotlib, and Pandas will serve as a template for business and scientific visualizations.
You’ll begin by installing Python 3, see how to work in Jupyter notebook, and explore Leather, Python’s popular data visualization charting library. You’ll also be introduced to the scientific Python 3 ecosystem and work with the basics of NumPy, an integral part of that ecosystem. Later chapters are focused on various NumPy routines along with getting started with Scientific Data visualization using matplotlib. You’ll review the visualization of 3D data using graphs and networks and finish up by looking at data visualization with Pandas, including the visualization of COVID-19 data sets.
The code examples are tested on popular platforms like Ubuntu, Windows, and Raspberry Pi OS. With Practical Python Data Visualization you’ll master the core concepts of data visualization with Pandas and the Jupyter notebook interface.
You’ll begin by installing Python 3, see how to work in Jupyter notebook, and explore Leather, Python’s popular data visualization charting library. You’ll also be introduced to the scientific Python 3 ecosystem and work with the basics of NumPy, an integral part of that ecosystem. Later chapters are focused on various NumPy routines along with getting started with Scientific Data visualization using matplotlib. You’ll review the visualization of 3D data using graphs and networks and finish up by looking at data visualization with Pandas, including the visualization of COVID-19 data sets.
The code examples are tested on popular platforms like Ubuntu, Windows, and Raspberry Pi OS. With Practical Python Data Visualization you’ll master the core concepts of data visualization with Pandas and the Jupyter notebook interface.
You will:
- Review practical aspects of Python Data Visualization with programming-friendly abstractions
- Install Python 3 and Jupyter on multiple platforms including Windows, Raspberry Pi, and Ubuntu
- Visualize COVID-19 data sets with Pandas
Caracteristici
Practical guide to embracing Python 3 Data Visualization for beginners and experienced people alike Bypasses the complexities of mathematics with simple lucid language Includes examples based on libraries such as leather, NumPy, Matplotlib, and Pandas