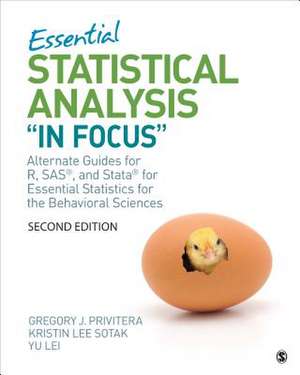
Essential Statistical Analysis "In Focus"
Autor Gregory J. Privitera, Kristin Lee Sotak, Yul Leien Limba Engleză Paperback – 7 iun 2018
Preț: 467.45 lei
Preț vechi: 549.95 lei
-15%
Puncte Express: 701
Carte tipărită la comandă
Livrare economică 28 decembrie 26 - 11 ianuarie 27
Livrare prin curier în România Termenul estimat este afișat lângă disponibilitate.
Transport gratuit pentru acest produs Plată online sau ramburs, în funcție de opțiunile comenzii.
Retur gratuit în 14 zile Comandă securizată și suport în română.
Specificații
ISBN-13: 9781544325842
ISBN-10: 1544325843
Pagini: 216
Dimensiuni: 203 x 254 x 12 mm
Greutate: 0.48 kg
Ediția:2. Auflage
Editura: Sage Publications, Inc
Locul publicării:Thousand Oaks, United States
ISBN-10: 1544325843
Pagini: 216
Dimensiuni: 203 x 254 x 12 mm
Greutate: 0.48 kg
Ediția:2. Auflage
Editura: Sage Publications, Inc
Locul publicării:Thousand Oaks, United States
Cuprins
About the Authors
About This Supplemental Guide
PART I. ANALYSIS IN FOCUS: R
R in Focus
To the Student—How to Use R With This Book
1.7 Entering and Defining Variables (p. 24)
2.4 Frequency Distributions for Quantitative Data (p. 47)
2.7 Frequency Distributions for Categorical Data (p. 52)
2.11 Histograms, Bar Charts, and Pie Charts (p. 62)
3.6 Mean, Median, and Mode (p. 94)
4.10 Range, Variance, and Standard Deviation (p. 124)
5.10 Converting Raw Scores to Standard z Scores (p. 155)
6.6 Estimating the Standard Error of the Mean (p. 178)
8.8 One-Sample t Test and Confidence Intervals (p. 244)
9.8 Two-Independent-Sample t Test and Confidence Intervals (p. 270)
10.7 The Related-Samples t Test and Confidence Intervals (p. 298)
11.5 The One-Way Between-Subjects ANOVA (p. 332)
11.9 The One-Way Within-Subjects ANOVA (p. 348)
12.7 The Two-Way Between-Subjects ANOVA (p. 393)
13.4 Pearson Correlation Coefficient (p. 419)
13.7 Computing the Alternatives to Pearson (p. 432)
13.11 Analysis of Regression (p. 445)
14.3 The Chi-Square Goodness-of-Fit Test (p. 468)
14.7 The Chi-Square Test for Independence (p. 480)
General Instructions Guide
PART II. ANALYSIS IN FOCUS: SAS
SAS in Focus
To the Student—How to Use SAS With This Book
1.7 Entering and Defining Variables (p. 24)
2.4 Frequency Distributions for Quantitative Data (p. 47)
2.7 Frequency Distributions for Categorical Data (p. 52)
2.11 Histograms, Bar Charts, and Pie Charts (p. 62)
3.6 Mean, Median, and Mode (p. 94)
4.10 Range, Variance, and Standard Deviation (p. 124)
5.10 Converting Raw Scores to Standard z Scores (p. 155)
6.6 Estimating the Standard Error of the Mean (p. 178)
8.8 One-Sample t Test and Confidence Intervals (p. 244)
9.8 Two-Independent-Sample t Test and Confidence Intervals (p. 270)
10.7 The Related-Samples t Test and Confidence Intervals (p. 298)
11.5 The One-Way Between-Subjects ANOVA (p. 332)
11.9 The One-Way Within-Subjects ANOVA (p. 348)
12.7 The Two-Way Between-Subjects ANOVA (p. 393)
13.4 Pearson Correlation Coefficient (p. 419)
13.7 Computing the Alternatives to Pearson (p. 432)
13.11 Analysis of Regression (p. 445)
14.3 The Chi-Square Goodness-of-Fit Test (p. 468)
14.7 The Chi-Square Test for Independence (p. 480)
General Instructions Guide
PART III. ANALYSIS IN FOCUS: STATA
Stata in Focus
To the Student—How to Use Stata With This Book
1.7 Entering and Defining Variables (p. 24)
2.4 Frequency Distributions for Quantitative Data (p. 47)
2.7 Frequency Distributions for Categorical Data (p. 52)
2.11 Histograms, Bar Charts, and Pie Charts (p. 62)
3.6 Mean, Median, and Mode (p. 94)
4.10 Range, Variance, and Standard Deviation (p. 124)
5.10 Converting Raw Scores to Standard z Scores (p. 155)
6.6 Estimating the Standard Error of the Mean (p. 178)
8.8 One-Sample t Test and Confidence Intervals (p. 244)
9.8 Two-Independent-Sample t Test and Confidence Intervals (p. 270)
10.7 The Related-Samples t Test and Confidence Intervals (p. 298)
11.5 The One-Way Between-Subjects ANOVA (p. 332)
11.9 The One-Way Within-Subjects ANOVA (p. 348)
12.7 The Two-Way Between-Subjects ANOVA (p. 393)
13.4 Pearson Correlation Coefficient (p. 419)
13.7 Computing the Alternatives to Pearson (p. 432)
13.11 Analysis of Regression (p. 445)
14.3 The Chi-Square Goodness-of-Fit Test (p. 468)
14.7 The Chi-Square Test for Independence (p. 480)
General Instructions Guide
References
Index
Notă biografică
Gregory J. Privitera is a professor of psychology at St. Bonaventure University where he is a recipient of its highest teaching honor, The Award for Professional Excellence in Teaching, and its highest honor for scholarship, The Award for Professional Excellence in Research and Publication. Dr. Privitera received his PhD in behavioral neuroscience in the field of psychology at the State University of New York at Buffalo and continued with his postdoctoral research at Arizona State University. He is a national award-winning author and research scholar. His textbooks span across diverse topics in psychology and the behavioral sciences, including two introductory psychology texts (one upcoming), four statistics texts, two research methods texts, and multiple other texts bridging knowledge creation across health, health care, and well-being. In addition, Dr. Privitera has authored more than three dozen peer-reviewed papers aimed at advancing our understanding of health and well-being. He research has earned recognition by the American Psychological Association, and in media and press to include Oprah¿s Magazine, Time Magazine, and the Wall Street Journal. In addition to his teaching, research, and advisement, Dr. Privitera is a veteran of the U.S. Marine Corps, is an identical twin, and is married with three children: a daughter, Grace Ann, and two sons, Aiden Andrew and Luca James.
Descriere
An alternate workbook to accompany Essential Statistics for the Behavioral Sciences, Second Edition, this text helps students to practice their skills and offers ‘In Focus’ sections for those using R, SAS or STATA as opposed to SPSS or Excel.