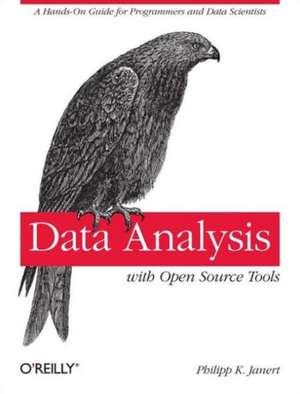
Data Analysis with Open Source Tools
Autor Philipp K. Janerten Limba Engleză Paperback – 28 dec 2010
Remarcăm în Data Analysis with Open Source Tools o structură progresivă riguroasă, care transformă analiza datelor dintr-o activitate abstractă într-un proces decizional aplicat. Autorul propune un parcurs logic: începem cu înțelegerea conținutului brut prin metode grafice, avansăm către construcția de modele conceptuale folosind argumente de probabilitate și scalare, și finalizăm prin integrarea acestor perspective în planuri de afaceri și indicatori de performanță. Această abordare de tip „de la concept la implementare” este susținută la finalul fiecărui capitol de ateliere practice, menite să fixeze noțiunile teoretice prin exercițiu direct. Credem că elementul distinctiv al acestei lucrări este accentul pus pe gândirea critică în detrimentul utilizării oarbe a instrumentelor software. Ca și J Ledolter în Data Mining and Business Analytics with R, autorul distilează experiență reală în principii acționabile, utilizând unelte open source pentru a modela seturi de date complexe. Totuși, Philipp K. Janert extinde discuția către sfera financiară, oferind claritate asupra unor concepte precum valoarea în timp a banilor, ceea ce face textul extrem de util pentru analiștii care operează în medii comerciale. În contextul operei sale, această carte reprezintă pilonul metodologic care completează lucrările sale mai tehnice, precum D3 for the Impatient sau Feedback Control for Computer Systems. Dacă lucrările anterioare se concentrau pe vizualizarea web sau controlul sistemelor, volumul de față oferă fundamentul matematic și analitic necesar oricărui programator experimentat care dorește să devină om de știință a datelor (data scientist). Tonul este unul tehnic și pragmatic, evitând generalitățile și oferind în schimb soluții pentru situații provocatoare prin analiza predictivă și tehnici de reducere a dimensionalității.
Preț: 245.10 lei
Carte disponibilă
Livrare economică 29 octombrie-12 noiembrie
Specificații
ISBN-10: 0596802358
Pagini: 530
Dimensiuni: 180 x 233 x 30 mm
Greutate: 0.87 kg
Editura: O'Reilly
V-ar putea interesa
-
 -18%Preț: 352.43 lei427.85 lei
 -
 Risk Analysis and the Security SurveyJames F. Broder-8%Preț: 374.37 lei406.93 lei
 -
 -16%Preț: 312.18 lei372.14 lei
 -
 Building an Intelligence-Led Security ProgramAllan Liska-35%Preț: 287.56 lei439.74 lei
 -
 Modern Competitive AnalysisSharon M. Oster-27%Preț: 1303.11 lei1785.08 lei
 -
 -28%Preț: 423.31 lei584.10 lei
 -
 Strategic Intelligence for the 21st Century: The Mosaic MethodAlfred Rolington-14%Preț: 296.74 lei346.45 lei
 -
 Intelligence AnalysisWayne Michael Hall-28%Preț: 381.72 lei531.27 lei
 -
 Proven Strategies in Competitive IntelligenceJohn E Prescott-8%Preț: 391.62 lei425.67 lei
 -
 Reshaping National Intelligence for an Age of InformationGregory F. TrevertonPreț: 259.88 lei
 -
 -34%Preț: 97.82 lei147.59 lei
 -
 -15%Preț: 505.95 lei595.24 lei
 -
 RiskDan Gardner-36%Preț: 87.27 lei135.48 lei
 -
 Preț: 135.61 lei
 -
 -20%Preț: 939.96 lei1174.95 lei
 -
 Big Data, Big AnalyticsMinelliPreț: 293.28 lei
 -
 -18%Preț: 1308.33 lei1595.54 lei
 -
 IntelligenceAnna T CiancioloPreț: 270.38 lei
 -
 Scripting IntelligenceMark Watson-20%Preț: 228.93 lei286.16 lei
 -
 Open Source Data Warehousing and Business IntelligenceLakshman Bulusu-20%Preț: 1123.60 lei1404.49 lei
 -
 Open Source Intelligence in a Networked WorldDr. Anthony OlcottPreț: 259.32 lei
 -
 -20%Preț: 1185.41 lei1481.77 lei
 -
 -20%Preț: 488.40 lei610.50 lei
De ce să citești această carte
Această carte se adresează programatorilor de nivel intermediar și experimentat care doresc să stăpânească analiza datelor fără a depinde de soluții software proprietare. Cititorul câștigă o metodologie clară pentru extragerea informațiilor relevante și transformarea lor în rapoarte de business. Este o resursă esențială deoarece învață utilizatorul cum să gândească rezultatele dorite, oferind totodată instrumentele matematice necesare pentru a le obține.
Despre autor
Philipp K. Janert, Ph.D., este un programator și om de știință cu o vastă experiență în matematică aplicată. Recunoscut la nivel internațional ca expert în analiză de date, el este un utilizator și dezvoltator activ al utilitarului gnuplot de peste două decenii. Cariera sa îmbină rigoarea academică cu necesitățile practice ale industriei software, Janert fiind autorul mai multor volume de referință publicate de O'Reilly. Expertiza sa în controlul feedback-ului și vizualizarea datelor îi permite să abordeze analiza informației dintr-o perspectivă sistemică și tehnică unică.
Descriere
Collecting data is relatively easy, but turning raw information into something useful requires that you know how to extract precisely what you need. With this insightful book, intermediate to experienced programmers interested in data analysis will learn techniques for working with data in a business environment. You'll learn how to look at data to discover what it contains, how to capture those ideas in conceptual models, and then feed your understanding back into the organization through business plans, metrics dashboards, and other applications.
Along the way, you'll experiment with concepts through hands-on workshops at the end of each chapter. Above all, you'll learn how to think about the results you want to achieve -- rather than rely on tools to think for you. * Use graphics to describe data with one, two, or dozens of variables * Develop conceptual models using back-of-the-envelope calculations, as well as scaling and probability arguments * Mine data with computationally intensive methods such as simulation and clustering * Make your conclusions understandable through reports, dashboards, and other metrics programs * Understand financial calculations, including the time-value of money * Use dimensionality reduction techniques or predictive analytics to conquer challenging data analysis situations * Become familiar with different open source programming environments for data analysis "Finally, a concise reference for understanding how to conquer piles of data." --Austin King, Senior Web Developer, Mozilla "An indispensable text for aspiring data scientists." --Michael E.
Driscoll, CEO/Founder, Dataspora